Bayes app for iPhone and iPad
Developer: brian drye
First release : 31 Jan 2014
App size: 556 Kb
Manipulate the sliders for pre-test probability, sensitivity, and specificity to visualize the
relationships in the graphical sample space.
The probability, sensitivity, and specificity values can also be input directly for specific tests.
The four color graphical sample space area provides an intuitive understanding of the ratios between:
False Positives
False Negatives
True Positives
True Negatives
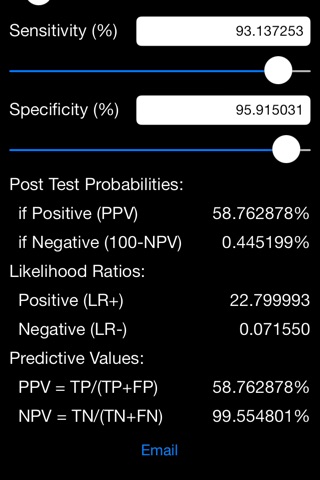
The generated calculations (to six decimal places) are updated automatically and show:
Post-test Probability of having a disease(D) if the test (T) result is positive P(D|T)
Post-test Probability if the test result is negative P(D|~T)
Positive Predictive Value (PPV)
Negative Predictive Value (NPV)
Positive Likelihood Ratio (LR+)
Negative Likelihood Ratio (LR-)
Easily share resulting calculations via email.


